
Release 2026.4 - Statistics
Statistics is so important if you want to understand how productive you really are. I don’t think we will ever find a perfect way to measure productivity, but we can certainly try.
On the brand-new statistics page, we made a lot of adjustments to make this task a little easier. First of all, now you can see your stats for the last 7 days instead of the current week. Before this change, it was difficult to tell how your week was different from the previous one until Sunday. Now, it takes just one glance at the widgets (more on them later). Secondly, we added filters, so you can cut the noise from the graph. For example, if you have a project for your leisure time and you want to know how much time you’ve spent on everything except this, you can toggle the project off.
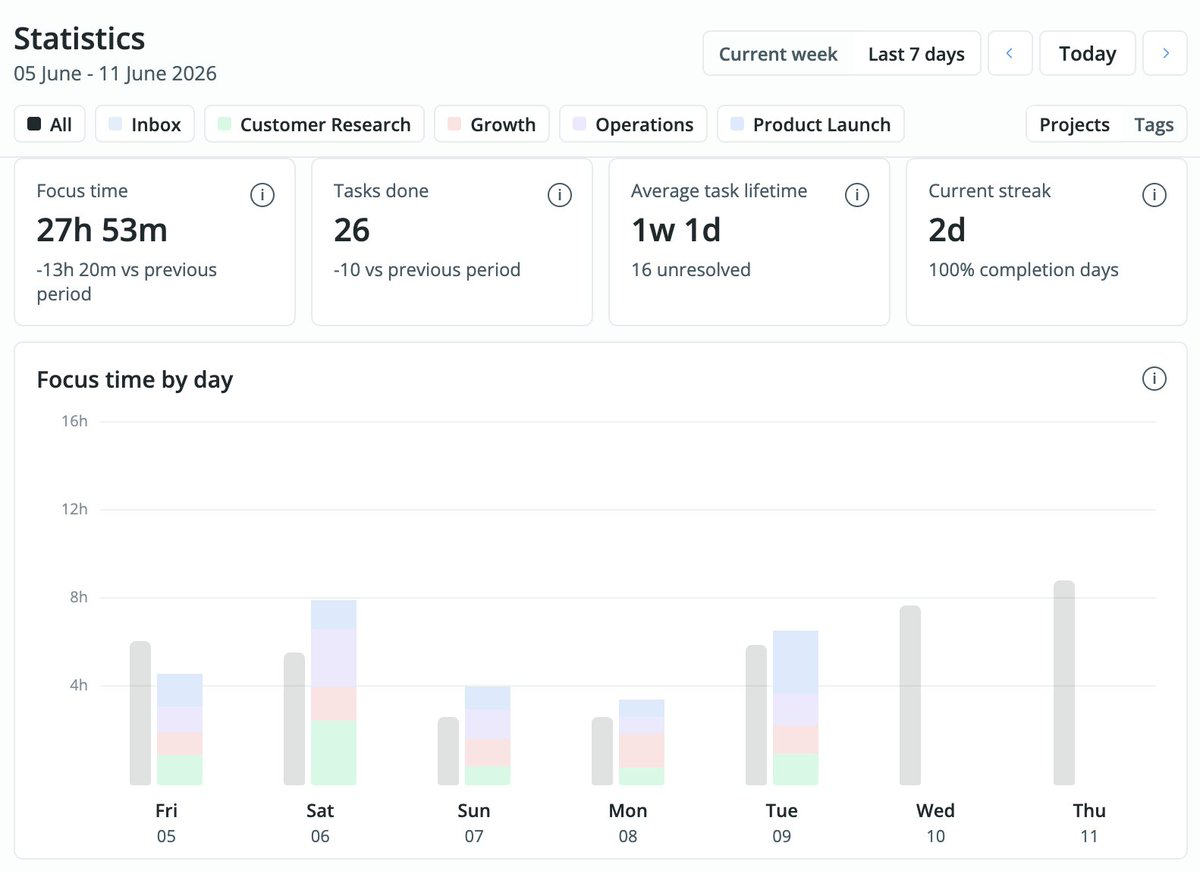
We’ve added 4 widgets for quick stats:
- Focus time. It shows amount of time you’ve spent on the selected projects during the selected period. I believe it is most important metric.
- Tasks done. I don’t like this metric, because it’s almost impossible to get the full picture from this number, but sometimes it helps to know it.
- Average task life time. Our new metric will help you to understand if you create more tasks that you complete. If this number is high, I would advise to take a step back and focus on the backlog.
- Current streak. If you use our regular daily notes as a container for your tasks, this will help you know how many days in a row you’ve been completing 100% of your planned tasks.
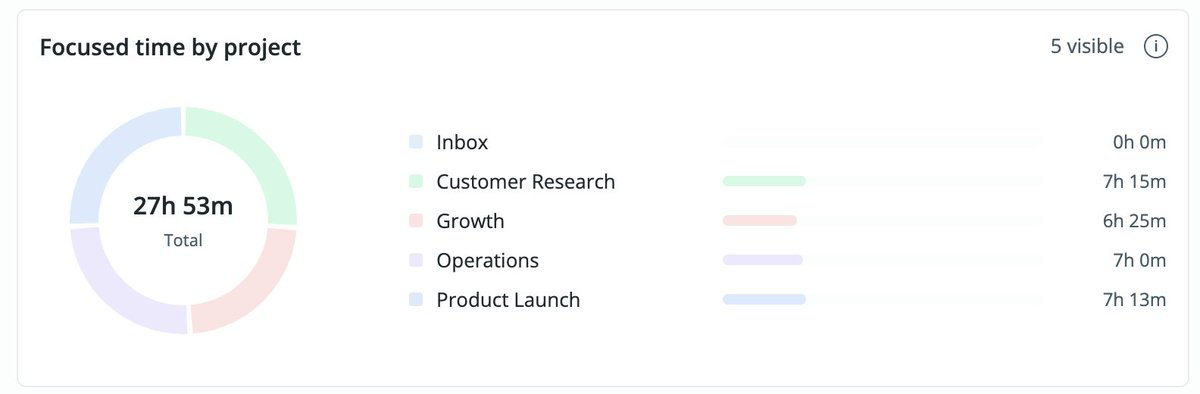
Our next chart shows how your time is split between different projects. There you can see if some part of your life is falling behind and needs more attention.
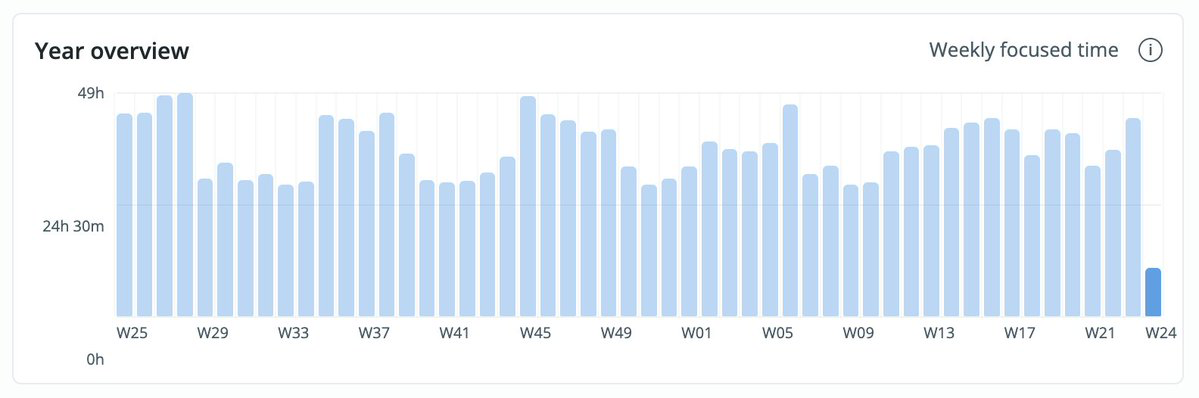
And finally we have rebuilt the Year overview from scratch. The goal is to show the ups and downs during your last 52 weeks.
The full statistics page is available for our subscribers, but you can use the app for free with some limitations.